Category: eBird Data
Site Guide to Birding Columbia County (Oregon)
Site Guide to Birding Columbia County (Oregon)
This is the twelfth installment of the “Site Guide”. It covers the area between Trojan Park and Laurel Beach County Park.
This guide will be published in a series of installments:
Overview of Columbia County (5/9/14 post)
Habitats of Columbia County (5/9/14 post)
Birds of Columbia County – Overview (5/9/14 post)
Birding Sites of Columbia County – Individual installments, and associated Bird Lists of the Sites in Columbia County:
Introduction (5/12/14 post)
Columbia River Sites – South to North
Sauvie Island (5/12/14 post)
Scappoose WTP and Kessi Pond (5/14/14 post)
Crown Zellerbach Trail – East End (5/15/14 post)
Scappoose Bottoms (5/19/14 post)
Scappoose Bay (5/29/14 post)
St. Helens WTP and Knob Hill Park (5/30/14 post)
Gray Cliffs Waterfront Park and Dalton Lake (6/1/14 post)
Dalton Lake Trail, Columbia City, Dyno Nobel, Nicolai Wetlands, Gobel Marina (6/17/14 post)
Trojan Park, Carr Slough, Prescott Beach, Laurel Beach CP (6/22/14 post)
(A link to a downloadable copy of this guide is found in the first installment of this series)
Columbia River Birding Areas
15) Trojan Park (OBT):
Location/Directions: (46.03591, -122.89386) Entrance to the park is 1.5 miles north of Gobel off of Hwy 30 (old Trojan Nuclear Plant site).
Habitat and Birds: There are a few ponds and a cottonwood gallery forest with walking trails for woodland birds. Ponds hold ducks and the occasional Horned Grebe. Bald Eagles nest in the area. You can also walk north along a paved trail that will take you to a blind and over look of the Carr Slough wetlands.
Trojan Park: (PL) – 38 species, 5 (5/14/14)
| Greater White-fronted Goose | Snow Goose | Cackling Goose |
| Canada Goose | Wood Duck | Gadwall |
| American Wigeon | Mallard | Green-winged Teal |
| Ring-necked Duck | Bufflehead | Hooded Merganser |
| Common Merganser | Pied-billed Grebe | Double-crested Cormorant |
| Great Blue Heron | Osprey | Bald Eagle |
| American Coot | Killdeer | Belted Kingfisher |
| Northern Flicker | Steller’s Jay | Western Scrub-Jay |
| American Crow | Common Raven | Tree Swallow |
| Black-capped Chickadee | Pacific Wren | Ruby-crowned Kinglet |
| American Robin | Varied Thrush | European Starling |
| Orange-crowned Warbler | Yellow-rumped Warbler | Song Sparrow |
| Dark-eyed Junco | Red-winged Blackbird |
16) Carr Slough – Graham Rd (OBT).
Location/Directions: (46.04791, -122.89784) 0.9 miles north of Trojan Park turn east onto Graham Rd. There is a small parking area just as you start on Graham Rd. on the south side. Graham Rd. is 0.4 miles long to the RR tracks.
Habitat and Birds: This is excellent duck habitat in the winter. It is a major wintering ground for Tundra Swan – Trumpeters can be mixed in as well. Scan tree tops for the local Bald Eagles. Great Egrets and Great Blue Herons can be thick at times, congregations of Hooded Merganser can get north of 50 birds, the roadside kack is productive year round for passerines swallows are numerous in the spring and Purple Martins have been recorded here.
Carr Slough (Graham Rd) (eHS) – 105 species, (5/14/14)
| Greater White-fronted Goose | Snow Goose | Cackling Goose |
| Canada Goose | Trumpeter Swan | Tundra Swan |
| Wood Duck | Gadwall | Eurasian Wigeon |
| American Wigeon | Mallard | Cinnamon Teal |
| Northern Shoveler | Northern Pintail | Green-winged Teal |
| Canvasback | Ring-necked Duck | Greater Scaup |
| Lesser Scaup | Bufflehead | Common Goldeneye |
| Barrow’s Goldeneye | Hooded Merganser | Common Merganser |
| Pied-billed Grebe | Horned Grebe | Western Grebe |
| Double-crested Cormorant | American White Pelican | Great Blue Heron |
| Great Egret | Turkey Vulture | Osprey |
| Bald Eagle | Red-shouldered Hawk | Red-tailed Hawk |
| American Coot | Sandhill Crane | Killdeer |
| Greater Yellowlegs | Long-billed Dowitcher | Wilson’s Snipe |
| Ring-billed Gull | California Gull | Herring Gull |
| Thayer’s Gull | Glaucous-winged Gull | Eurasian Collared-Dove |
| Mourning Dove | Vaux’s Swift | Anna’s Hummingbird |
| Belted Kingfisher | Red-breasted Sapsucker | Downy Woodpecker |
| Hairy Woodpecker | Northern Flicker | American Kestrel |
| Western Wood-Pewee | Willow Flycatcher | Steller’s Jay |
| Western Scrub-Jay | American Crow | Common Raven |
| Northern Rough-winged Swallow | Purple Martin | Tree Swallow |
| Violet-green Swallow | Barn Swallow | Cliff Swallow |
| Black-capped Chickadee | Chestnut-backed Chickadee | Bushtit |
| Red-breasted Nuthatch | Brown Creeper | Pacific Wren |
| Marsh Wren | Bewick’s Wren | Golden-crowned Kinglet |
| Ruby-crowned Kinglet | Swainson’s Thrush | Hermit Thrush |
| American Robin | Varied Thrush | European Starling |
| Cedar Waxwing | Orange-crowned Warbler | Common Yellowthroat |
| Yellow Warbler | Yellow-rumped Warbler | Black-throated Gray |
| Wilson’s Warbler | Spotted Towhee | Fox Sparrow |
| Song Sparrow | Lincoln’s Sparrow | White-crowned Sparrow |
| Golden-crowned Sparrow | Dark-eyed Junco | Western Tanager |
| Red-winged Blackbird | Brewer’s Blackbird | House Finch |
| Purple Finch | Pine Siskin | American Goldfinch |
17) Prescott Beach County Park (OBT):
Location/Directions: (46.05076, -122.88797) On Graham Rd. 0.6 miles from Hwy 30 is the entrance to the park. Day use fee is required.
Habitat and Birds: The river view can have all manner of river birds, loons, grebes, gulls and ducks in season. There is decent passerine habitat in pockets. No patch list has been generated.
18) Laurel Beach County Park:
Location/Directions: (46.07097, -122.899504) – This park is poorly mapped on Google Maps. Access is from Laurel Wood Rd. Turn north onto Laurel Wood Rd. stay left at the fork and go about 0.1 miles to the park entrance road – there is a sign for the park. Follow the gravel road down to the parking area.
Habitat and Birds: Rafts of ducks can be found in winter as there is a bit of a sheltered cove. Both Scaup and Common Goldeneye are regular. Some woodland birds can be found in the parking area. This is the easiest place for Goldeneye in the county with Barrow’s possible as a report of one comes from this vantage point.
Laurel Beach County Park (PL) – 27 species, 6 (5/14/14)
| Canada Goose | Greater Scaup | Lesser Scaup |
| Common Goldeneye | Common Merganser | Western Grebe |
| Double-crested Cormorant | Herring Gull | Downy Woodpecker |
| Steller’s Jay | American Crow | Black-capped Chickadee |
| Chestnut-backed Chickadee | Bushtit | Red-breasted Nuthatch |
| Pacific Wren | Golden-crowned Kinglet | Ruby-crowned Kinglet |
| American Robin | Varied Thrush | European Starling |
| Spotted Towhee | Song Sparrow | Dark-eyed Junco |
| Pine Siskin |
Site Guide to Birding Columbia County (Oregon)
This guide will be published in a series of installments:
Overview of Columbia County
Habitats of Columbia County
Birds of Columbia County – Overview
Birding Sites of Columbia County – Individual installments, and associated:
Bird Lists of the Sites in Columbia County
This Guide is a work in progress. The current Guide will always be up to date at the download location found below. This web based version may or may not be updated.
A lot of the information for this Guide was collected from around the web. I have provided attributed links so the source information can be referenced directly. Any errors in transcription are those of the author as are any additions that do not match the source material exactly. If the reader is so inclined; broken links, errors, or general comments can be sent via the Contact page or in the “Comments” of individual posts.
Large portions of this guide are currently being incorporated into the “Birding Oregon” guide to “Birding Sites in Oregon” maintained by the East Cascades Audubon Society.
Site Guide for Birding Columbia County – last edited: 10/13/14
(Here is a link to a downloadable copy of this Field Guide)
Overview:
Columbia County is bordered on the north and east by the Columbia River, on the south by Multnomah County and Washington County, and on the west by Clatsop County. The southern County line is approximately 30 minutes from Portland, the largest metropolitan area in Oregon. The western County line is approximately 30 minutes from the Pacific coast.
The County’s northern and eastern boundaries are outlined by 62 miles of Columbia River shoreline. Columbia County enjoys the longest stretch of the Columbia River in the State of Oregon. The Columbia River is a major route of ocean-going vessels and is a popular fishing ground, as well as a popular boating and windsurfing river.
The County offers the only two marine parks in Oregon: Sand Island on the Columbia River and J.J. Collins Memorial Marine Park on the Multnomah Channel. This is known locally as Coon Island.
(Source: ColumbiaCounty.or.us)
According to the U.S. Census Bureau, the county has a total area of 688 square miles (1,781.9 km2), of which 657 square miles (1,701.6 km2) is land and 32 square miles (82.9 km2) (4.59%) is water. The vast majority of this is in managed coast range forest with limited accessibility.
Habitats of Columbia County
There are three EPA Level IV designated ecoregions in the county:
Level IV: (1d) Coast Range Volcanics
The Volcanics ecoregion consists of steeply sloping mountains and capes underlain by fractured basaltic rocks. Elevation generally varies from 600 to 4100 feet (180 to 1250 m), although in some places the volcanic rock extends down to sea level. The region is marked by columnar and pillow basalt outcrops. Its mountains may have been offshore seamounts engulfed by continental sediments about 200 million years ago. High gradient, cascading streams and rivers occur, and the basaltic substrate preserves summer flows that are more consistent than streams on the sedimentary rocks in surrounding ecoregions.
The streams still support runs of spring Chinook salmon and summer steelhead. The region’s Douglas-fir plantations are heavily logged. Mature forests consist of Douglas-fir, western hemlock, salal, sword fern, vine maple, Oregon grape, and rhododendron. Wetter slopes and riparian areas may support western red cedar, big leaf maple, red alder, salmonberry, and oxalis. Grassy coastal headlands and mountaintop balds feature Roemer’s fescue, thin bentgrass, California oatgrass, and diverse forbs.
Level IV: (1f) Willapa Hills
The Willapa Hills ecoregion (named for the Willapa Hills) consists of low, rolling hills and low, gently sloping mountains with medium gradient streams and rivers. It rises to an elevation of approximately 1,300 feet (396 m).
This region has a lower drainage density than other upland areas in the Coast Range. Logging is relatively easy and less expensive in this accessible terrain, and industrial timberland has almost completely replaced the historic forests. When disturbed, the silt- and clay-textured soils are easily eroded, thereby degrading stream quality.
The vegetation consists of Douglas-fir and western hemlock forests, with sword fern, vine maple, salal, Oregon grape, and rhododendron shrub layer. Wetter slopes and riparian areas support red alder, western red cedar, big leaf maple, salmonberry, and oxalis. Large herds of Roosevelt elk winter in the region.
Level IV: (3a) Portland/Vancouver Basin
The Portland/Vancouver Basin ecoregion (named for the cities of Portland and Vancouver) is a geological depression at the base of the Portland Hills fault-block. The region covers 305 square miles (790 km2) in Washington and 269 square miles (697 km2) in Oregon, including the northern and eastern suburbs of the Portland metropolitan area. It contains the confluence of the Willamette and Columbia Rivers and is composed of deltaic sands and gravels deposited by Pleistocene floods, notably the Missoula Floods. Elevation varies from 0 to 300 feet (0 to 90 m), with buttes as high as 650 feet (200 m).
Historically, the basin was characterized by Oregon white oak groves and Douglas-fir forests on the uplands; black cottonwood groves on riverbanks and islands; Oregon ash, red alder, and western red cedar in riparian areas; and prairie openings maintained by Native American burning, with camas, sedges, tufted hairgrass, fescue, and California oatgrass. Numerous wetlands, oxbow lakes, and ponds can still be found, but today the region is dominated by urban and suburban development, pastures, cropland, and tree farms.
The climate is usually marine-influenced, but easterly winds from the Columbia River Gorge periodically bring continental temperature extremes. It contains several National Wildlife Refuges within the Ridgefield National Wildlife Refuge Complex.[2][3]
——————————————————————————————
That’s the big picture. From a birder’s perspective there are basically four major habitats: 1) the Columbia River, 2) lowland basins bordering the river, 3) the hills of the Coast Range and 4) urban and rural residential areas.
The Columbia River is essentially monotypic, but not quite. There are numerous islands, sheltered coves and inlets that break up the flow, offer some measure of protection and vary the habitat a bit. It is on the Columbia where the best chances of finding divers and stray gulls will be found.
The lowland basins bordering the Columbia offer the largest diversity of habitat, and on Sauvie Island the only terrestrially accessible area managed for wildlife. There are three separate basins along the Columbia. The first is the Portland/Vancouver basin which goes as far north as St. Helens and south to the southern border of the County on Sauvie Island. The second is the Rainier Basin which is an alluvial plain of the Columbia piled up against rapidly ascending Willapa Hills. And third is the Clatskanie basin including the Marshland Drainage District which is a large pocket of lowland around the Clatskanie River and is flood controlled by a series of dikes. One could arguably call the Trojan lowlands a fourth. It is within these lowlands, bordering the Columbia, that the greatest diversity of birds will be found in the County.
The hills of the Coast Range, while not completely monotypic, it’s darn close. The Nehalem River and it’s tributaries cuts a riparian zone through the hills, there are a few agricultural stretches on suitable land, mostly lying along major creeks like Milton Creek, and a few lakes here and there. But the vast majority of this land is held privately and is managed for timber. There are numerous gravel roads throughout and most timber lands allow walk-in access. It is in the hills where the elevational birds like grouse, Hermit Warblers, and Red Crossbills will be most easily found.
The urban and rural residential areas are not specifically covered in this guide, aside from a few parks. But the towns of Scappoose, St. Helens, Columbia City, Rainier, and Clatskanie all have potential to be additive to a day in the field.
Mining eBird Data – Comparing Specie Count Records
Back in January we looked at the specie counts by county from available eBird records. How does that data compare to other available records?
I’m not sure there is an “official” data set for this information but the best i could come up with comes from the East Cascades Audubon Society (ECAS). Drilling into their Birding Sites page one will find access to County Checklists. It is from these checklists that a data set was created. Thankfully there are only 36 counties in Oregon because stripping data from a .pdf is notoriously difficult. (note to editors: a .csv file would make this data more accessible to data junkies. Heck, even a .xls(x) file would be preferable.)
The official record keeper for Oregon is the Oregon Field Ornithologists, now Oregon Birding Association. They do not keep records at the County level that i am aware of, and none of their data is accessible in any meaningful way for our purposes, again, all .pdf files.
The comparison between ECAS records and eBird records (as of January 2013) is presented below. There are three choropleths; one for ECAS records, one for eBird records and one for the difference between the two, and one bar graph with all three metrics. The choropleths use a purple – blue – green scale, low to high, from a scale of 180 (eBird min.) to 410 (ECAS high). The choropleths were generated using ggplot2 in ‘R’ and the color scheme is from Color Brewer. I threw in a fourth map with the County names.
Summary Statistics:
ECAS Records:
- Min = 249
- Mean = 318
- Max = 410
eBird Records
- Min = 182
- Mean = 254
- Max = 349
ECAS – eBird (delta)
- Min = 17
- Mean = 64
- Max = 105
Of course this leads one to speculate on the causes for the discrepancies.
The most obvious is the time frame embedded in the two data sets. I assume the ECAS records are based on historical records. Although i don’t see California Condor listed in any of the County records so i’m not sure how far back they go, and no attributing reference is made to the source of the data set that i could find. eBird is a relatively new data set. Some effort has been made to enter historic records into eBird but im not sure if Oregon has been part of that effort. Some existing eBird users have entered their data from the past, but i’m pretty sure that is not universal among users with Oregon data, i know that i haven’t done it. So there’s that.
The other thing to ponder is the variation in the delta statistic. I suspect some of the same factors considered back in January are in play:
- Number of eBirders in the County
- eBirder interest in specific locations within a County
- Accessibility of the County
- Proximity of the County to large population centers
- Interest within a County by “hyper-active” eBirders
- Amount of eBird recorded observation time spent vs ECAS
- others?
So here’s the data representations:
-

- County Names over eBird County Specie Count
-

- ECAS County Specie Counts
-

- eBird County Specie Counts
-

- ECAS Data Set – eBird Data Set (delta)

Mining eBird Data – Checklists by County
Using eBird data from 2010 through 2012 — 1) which County in Oregon has submitted the most checklists?
2) Given the unequal distribution of the state’s population — which County in Oregon has submitted the most checklists per capita?
What variables are in play that would determine these metrics? Can we assume that birder density per capita is relatively constant from county to county? Can we assume the use of eBird will be a constant within the birding community once growth flattens out?
Possible set of variables that contribute to the number of checklists submitted in each County:
- Number of eBirders in the County
- eBirder interest in specific locations within a County
- Accessibility of the County
- Proximity of the County to large population centers
- Interest within a County by “hyper-active” eBirders
- others?
Well the answer to the first question is Benton County with 9,878 checklists submitted over the three years — averaging 63 checklists a week. Benton county? It has a population of 85 thousand. The Portland Metro Tri-county Area by contrast has 735 thousand in Multnomah, 530 thousand in Washington and 376 thousand in Clackamas counties. That’s 8.6, 6.2, and 4.4 times as many people respectively than Benton County.
OK, the William L. Finley National Wildlife Refuge is in Benton County – the crown jewel in the Willamette Valley’s system of NWR’s. There’s almost certainly more going on here than Finley – variable number 5. The single top contributor from each of the three years in Benton County submitted 50% of those 9,878 lists. In this case it happens to be the same individual. In contrast, the top five contributors combined only make up 37% of the lists submitted in Multnomah County. Eight different individuals had one of the fifteen available top 5 slots over the three years.
The answer to the second question is, unsurprisingly, Harney with 338 lists submitted per 1000 residents – variable number 2. Harney County has more than twice the lists per capita than any other county. However, somewhat surprising was the second highest county with 166 lists per capita — Sherman. Here another factor may be at work. There are only 1700 residents in Sherman County. It doesn’t take many checklists to bump this number up quite quickly. Obviously the lists per capita is not a very meaningful metric.
What’s this all mean — i have no idea, other than we can plot the relative density of eBird usage by county. Anyway —
I was loathe to subject anyone to another set of awful “heat maps” showing checklist data by county so i found a work around in ‘R’. A free statistical software package; the ggplot2 library in particular. Roughly one month later the following set of choropleths (yeah, not heat maps, who knew?) have been generated. And just for reference, one with the county names layered over total specie count. I’ll probably update the earlier choropleths with these cleaner ones.


Mining eBird Data – Checklists per Week Update
The 25 January post was about the growth in eBird reporting in Oregon.
I periodically update the database with current data and was astonished at what happened in the third reporting week in February!
-

- Oregon Checklists Submitted to eBird by Week
A little digging and i found out that Cornell jointly runs the Great Backyard Bird Count project. It seems the GBBC used the eBird platform for reporting this year. All of that data is now showing up in the database.
I’ve only submitted data to the GBBC a couple of times. But i noticed the reporting output is now eBird based which is quite different than the GBBC output i remember. No big deal to me but i wonder how annual participants feel about it.
Mining eBird Data – continued.
Having compiled the weekly observation data to plot the growth of eBird usage in previous posts, we will now look at the composite weekly and monthly time series.
I took the median number of observations submitted to eBird for each week from 2007 through 2012. I chose the median over the average to dampen the effect growth has on the distribution of this small sample size (n=6).
Below are four graphs; two for the weekly data and two for the monthly data. The first in each set is a time series plot and the second is a ranking plot in descending order. (left click to enlarge)
I’m not sure what real conclusions can be made but speculations come easy. I’ll leave those to you and only note, that while May was no surprise, September would not have been my guess for having the lowest number of records submitted.
Tom Auer has been looking at the same data for Rhode Island over on his blog – here.
He makes, what I think, is an important point:
“One of the goals of eBird is consistent sampling effort. This is why all checklists matter as long as they’re complete, including the five minute backyard counts in urban areas. If the only checklists that were ever submitted were from birding hotspots at the peak of migration when birders were chasing vagrants, we’d have a very skewed view of the bird world. Ideally, the number of checklists submitted by week would be the same throughout the year.”
So – get out there in September and October.
Also while you’re at it, see if you can’t make it over to Wheeler, Gilliam or Baker Counties, they have the least number of records submitted – I’m pretty sure there are birds there. In keeping with eBird’s call to “bird the road less traveled” we’ll dive a little deeper into the county data in a future post.
-

- Weekly Time Series
-

- Weekly Ranking
-

- Monthly Time Series
-

- Monthly Ranking
Mining Oregon eBird Data – IV
Back on Tuesday the 22nd, we put forth the hypothesis “More people are using eBird”.
I have not been able to find data points for the actual number of observers when that number goes over a hundred. Some counties have less than 100 observers per year but many don’t so it is not possible with the data i have to determine the actual number of eBird recorders in Oregon. But what is possible is to tally the number of checklists submitted.
For all of Oregon it looks like this:
| Year | Lists |
| 2009 | 7,774 |
| 2010 | 16,612 |
| 2011 | 25,730 |
| 2012 | 39,745 |
Plotted by week is shown below (Left Click to Enlarge):

Number of Checklists Submitted to eBird by Week.
Extrapolating from existing 2013 data would yield a approximate 2013 total of 63,750
Growth in the number of checklists submitted in Oregon is shown in the table below:
| Year | Lists | Growth |
| 2009 | 7,777 | |
| 2010 | 16,612 | 114% |
| 2011 | 25,730 | 55% |
| 2012 | 39,745 | 54% |
| 2013 | 63,682 | 60% |
At the County level, using only 2010 to 2012 data, eBird reporting from 2010 to 2012 is shown in the (large) table below:
| County | 2010 | 2011 | 2012 | Total | % Growth (’10 to ’12) |
| MORROW | 11 | 23 | 262 | 296 | 2281.8% |
| COLUMBIA | 66 | 256 | 478 | 800 | 624.2% |
| UNION | 39 | 89 | 238 | 366 | 510.3% |
| LINN | 107 | 374 | 625 | 1,106 | 484.1% |
| YAMHILL | 91 | 153 | 432 | 676 | 374.7% |
| DOUGLAS | 152 | 401 | 693 | 1,246 | 355.9% |
| POLK | 263 | 485 | 1,143 | 1,891 | 334.6% |
| UMATILLA | 58 | 106 | 246 | 410 | 324.1% |
| HARNEY | 438 | 545 | 1,529 | 2,512 | 249.1% |
| BENTON | 1,331 | 3,921 | 4,626 | 9,878 | 247.6% |
| LINCOLN | 758 | 1,412 | 2,564 | 4,734 | 238.3% |
| LANE | 954 | 1,466 | 3,112 | 5,532 | 226.2% |
| SHERMAN | 43 | 115 | 135 | 293 | 214.0% |
| TILLAMOOK | 394 | 638 | 1,219 | 2,251 | 209.4% |
| GRANT | 39 | 36 | 116 | 191 | 197.4% |
| WASCO | 151 | 168 | 438 | 757 | 190.1% |
| KLAMATH | 669 | 1,050 | 1,916 | 3,635 | 186.4% |
| MALHEUR | 59 | 61 | 164 | 284 | 178.0% |
| GILLIAM | 20 | 33 | 51 | 104 | 155.0% |
| MULTNOMAH | 1,833 | 3,081 | 4,606 | 9,520 | 151.3% |
| CLATSOP | 248 | 414 | 606 | 1,268 | 144.4% |
| COOS | 373 | 395 | 891 | 1,659 | 138.9% |
| WASHINGTON | 1,521 | 2,155 | 3,439 | 7,115 | 126.1% |
| MARION | 584 | 886 | 1,307 | 2,777 | 123.8% |
| CLACKAMAS | 635 | 1,028 | 1,360 | 3,023 | 114.2% |
| WALLOWA | 50 | 57 | 102 | 209 | 104.0% |
| JOSEPHINE | 145 | 172 | 262 | 579 | 80.7% |
| HOOD RIVER | 112 | 147 | 186 | 445 | 66.1% |
| JACKSON | 1,757 | 2,084 | 2,788 | 6,629 | 58.7% |
| WHEELER | 26 | 100 | 41 | 167 | 57.7% |
| DESCHUTES | 1,325 | 1,487 | 1,849 | 4,661 | 39.5% |
| BAKER | 30 | 32 | 40 | 102 | 33.3% |
| LAKE | 310 | 328 | 385 | 1,023 | 24.2% |
| JEFFERSON | 292 | 315 | 307 | 914 | 5.1% |
| CROOK | 844 | 1,105 | 810 | 2,759 | -4.0% |
| CURRY | 884 | 612 | 779 | 2,275 | -11.9% |
.. with the data points representing the number of checklists submitted to eBird per year.
The same data representation for all of Oregon:
| 2010 | 2011 | 2012 | Total | % Growth (’10 to ’12) | |
| Oregon Total | 16,612 | 25,730 | 39,745 | 82,087 | 139% |
I think that’s rather impressive. Not only in the expanded use but in the shear volume of the reports. (we’re going to need more Oregon eBird Reviewers at this pace)
With eBird’s stated purpose: “With thousands of birdwatchers across the continent helping to construct it [the eBird database] by contributing their sightings, eBird will soon become a vast source of bird and environmental information useful not only to bird watchers but to scientists and conservationists the world over.” I’d say Oregon eBirders are doing their part.
Mining Oregon eBird Data – III
A couple of day’s back we presented the county heat maps by year for the years 2010 through 2012.
Today we’ll put the specie count numbers to those maps. These three maps are below.
There are quite a few dynamics at play in determining the number of specie recorded each year. Here a few off the top of my head:
Physical upper limit of specie present in any given year
Effort put into finding them (more on this in a later post)
Population size within a county – related to above
Percentage of eBird recorders within the population
Ability of a county to draw eBird recorders (like Harney)
Unequal distribution of avian wild life
Any others?

2010 eBird Data – Specie Count by County

2011 eBird Data – Specie Count by County

2012 eBird Data – Specie Count by County
Mining Oregon eBird Data – II
A follow-up to yesterday’s post.
Presented in the two maps below you will find specie count representations for all of the data in eBird for the state of Oregon as of 21 January 2013.
The first is a county heat map and the second is the specific specie count by county.
It’s no surprise that Lane County consistently has the highest counts. Ranging from the coast to the crest of the Cascades it covers ten Level IV Ecoregions. It also has the fourth highest population and fifth largest land mass of Oregon’s thirty six counties. I’m sure the avid birding population of the Eugene area also helps.

 Specie Count by County — eBird Data as of 21 Jan 2013
Mining Oregon eBird Data
I took a look at some eBird data going back to 2010. Using the “Top 100” feature i pulled up the data for each county from 2010 to 2012.
At the top of each of these records is the number of species seen in each county. While i’m not a fan of the county list – it’s all that eBird has. A county is an imaginary boundary that birds have no use for. The ecoregion concept is much closer to what the birds perceive in the environment — particular habitat. But even this concept has it’s limitations because of micro-habitats.
Anyway, this first post will show heat maps for the three years. (pretty bad heat maps, but the best i could do with MS Paint)
My hypothesis? More people are using eBird.
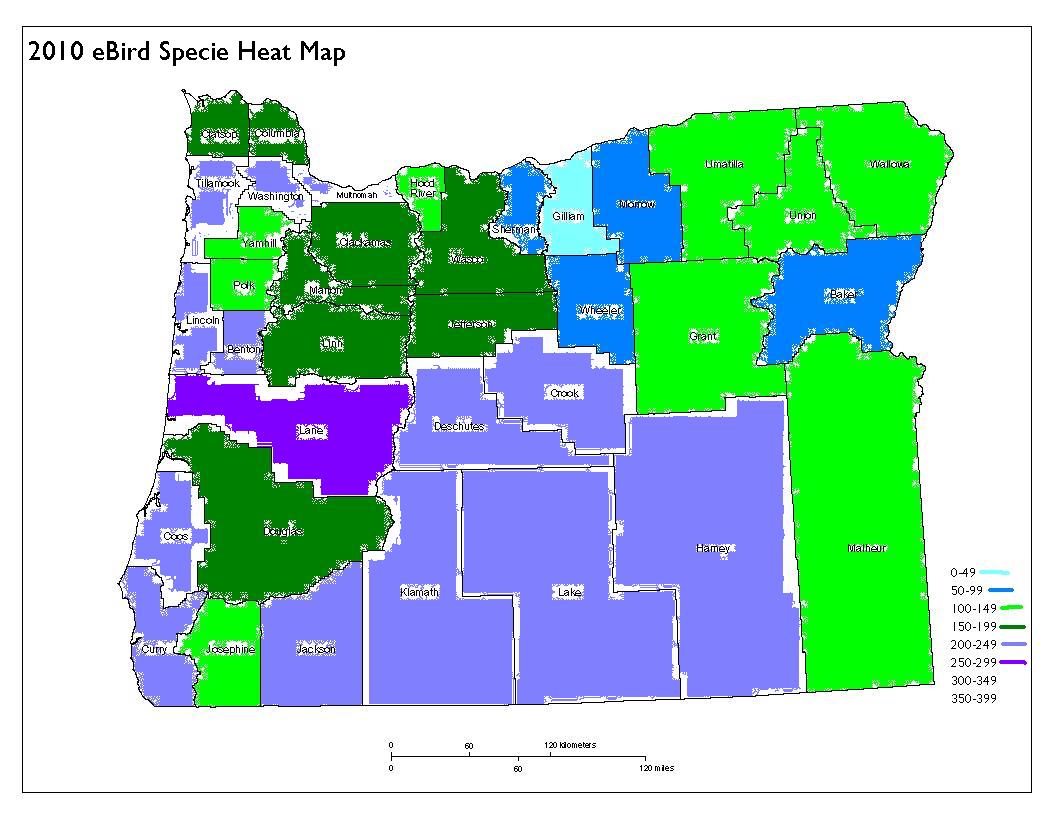
2010 eBird Data – Specie Count by County

2011 eBird Data – Specie Count by County

2012 eBird Data – Specie Count by County
